What the Headlines Miss
A living knowledge graph that maps the connections between geopolitical actors, assets, and events — and surfaces the scenarios most likely to unfold.
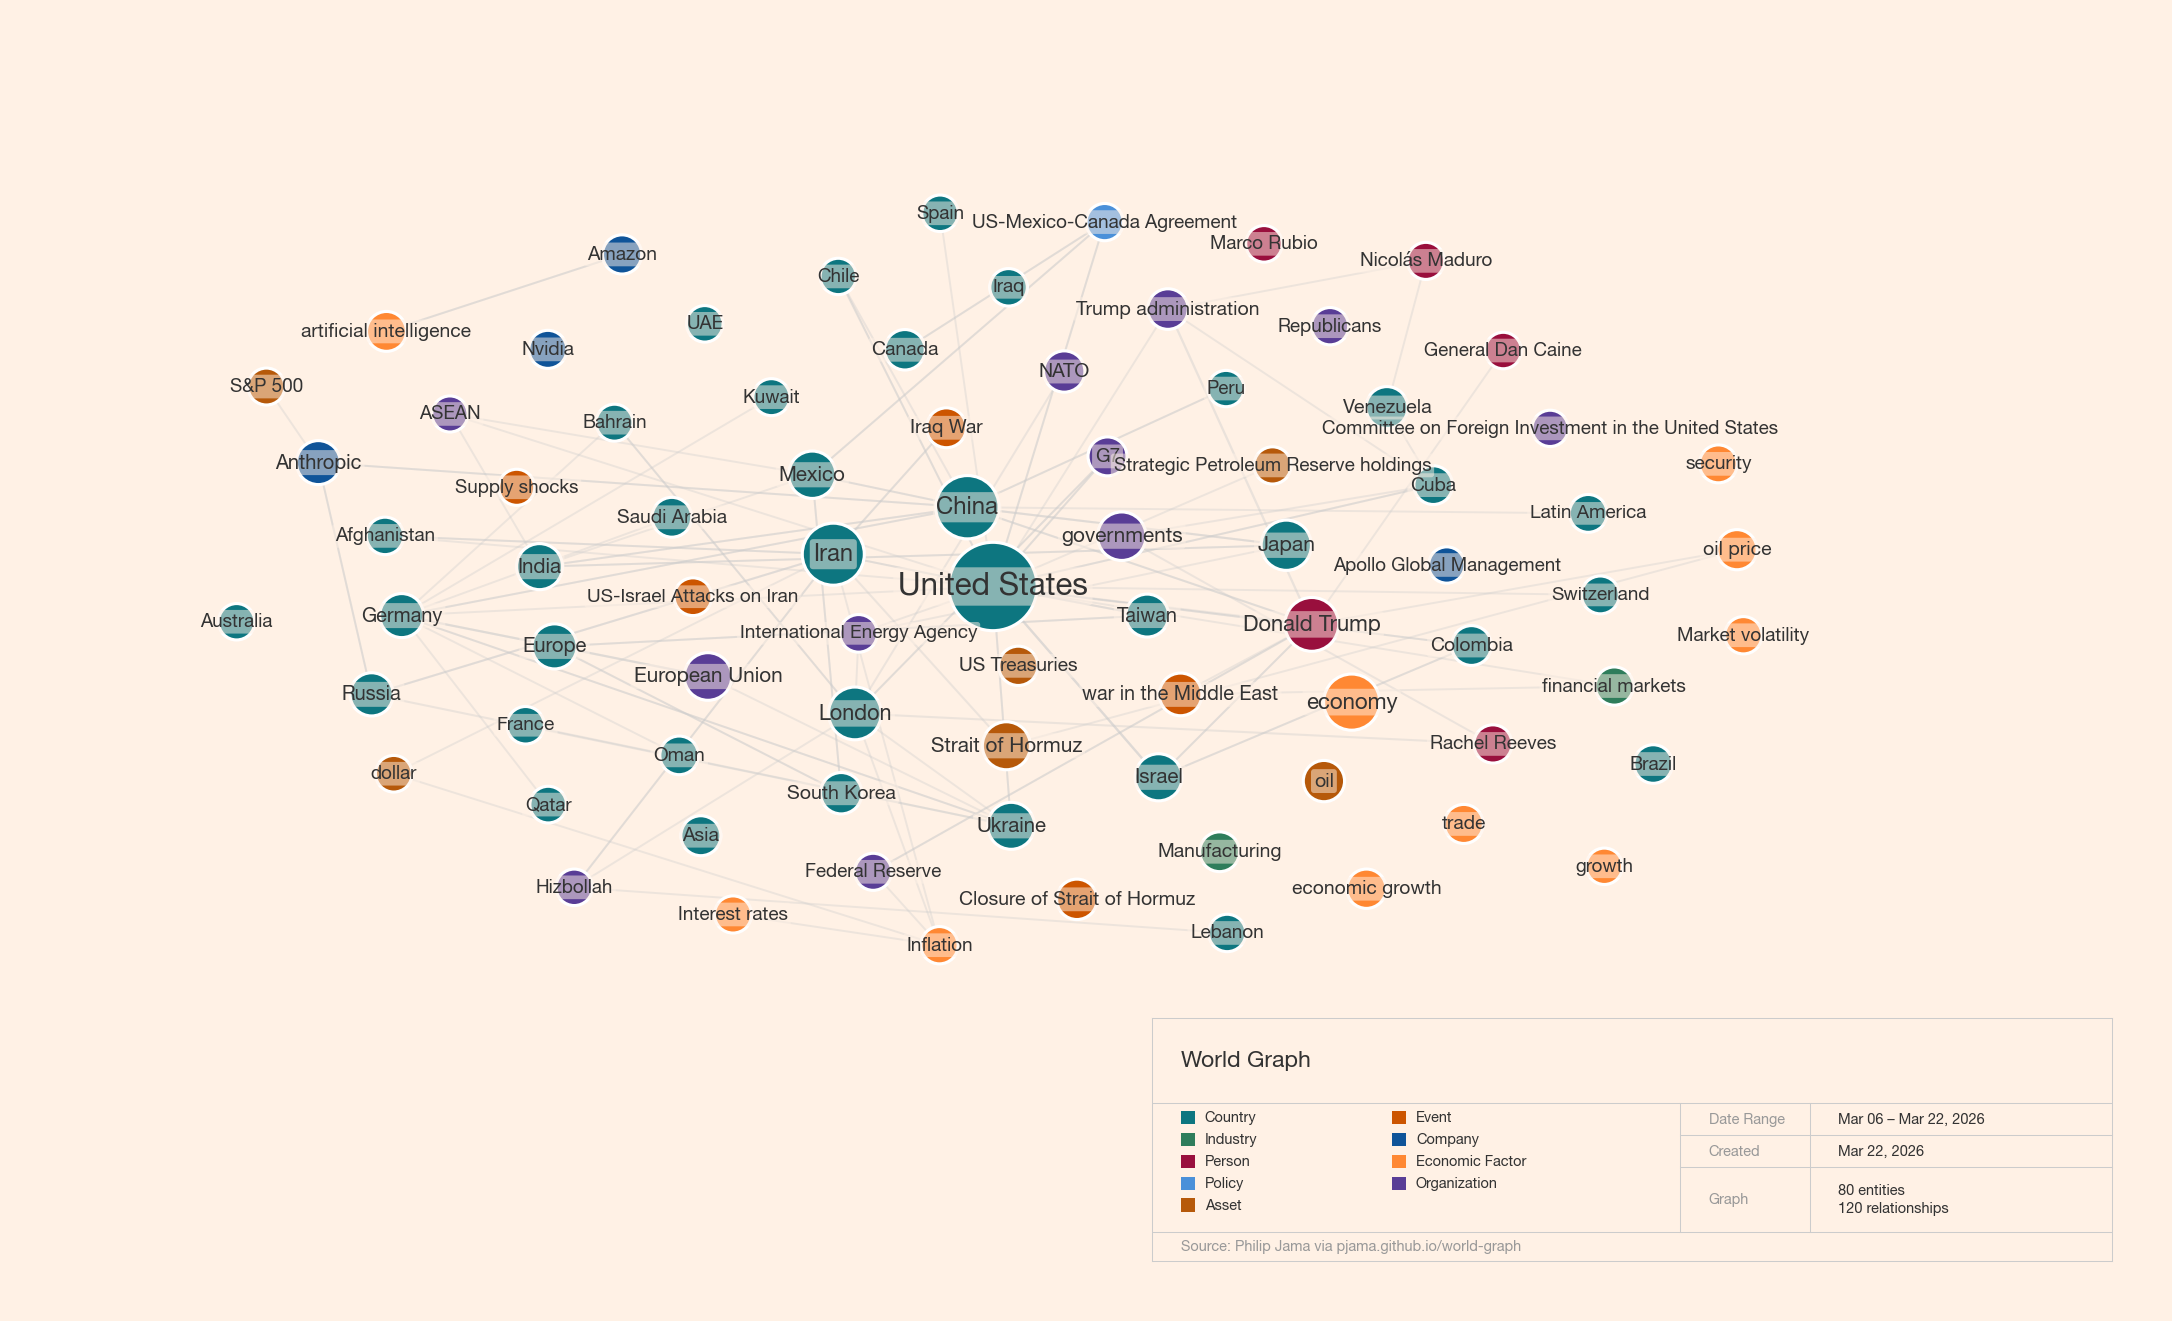
Graph Intelligence in Action
Countries, assets, leaders, and economic factors mapped around a single geopolitical event — with typed relationships and causal connections.
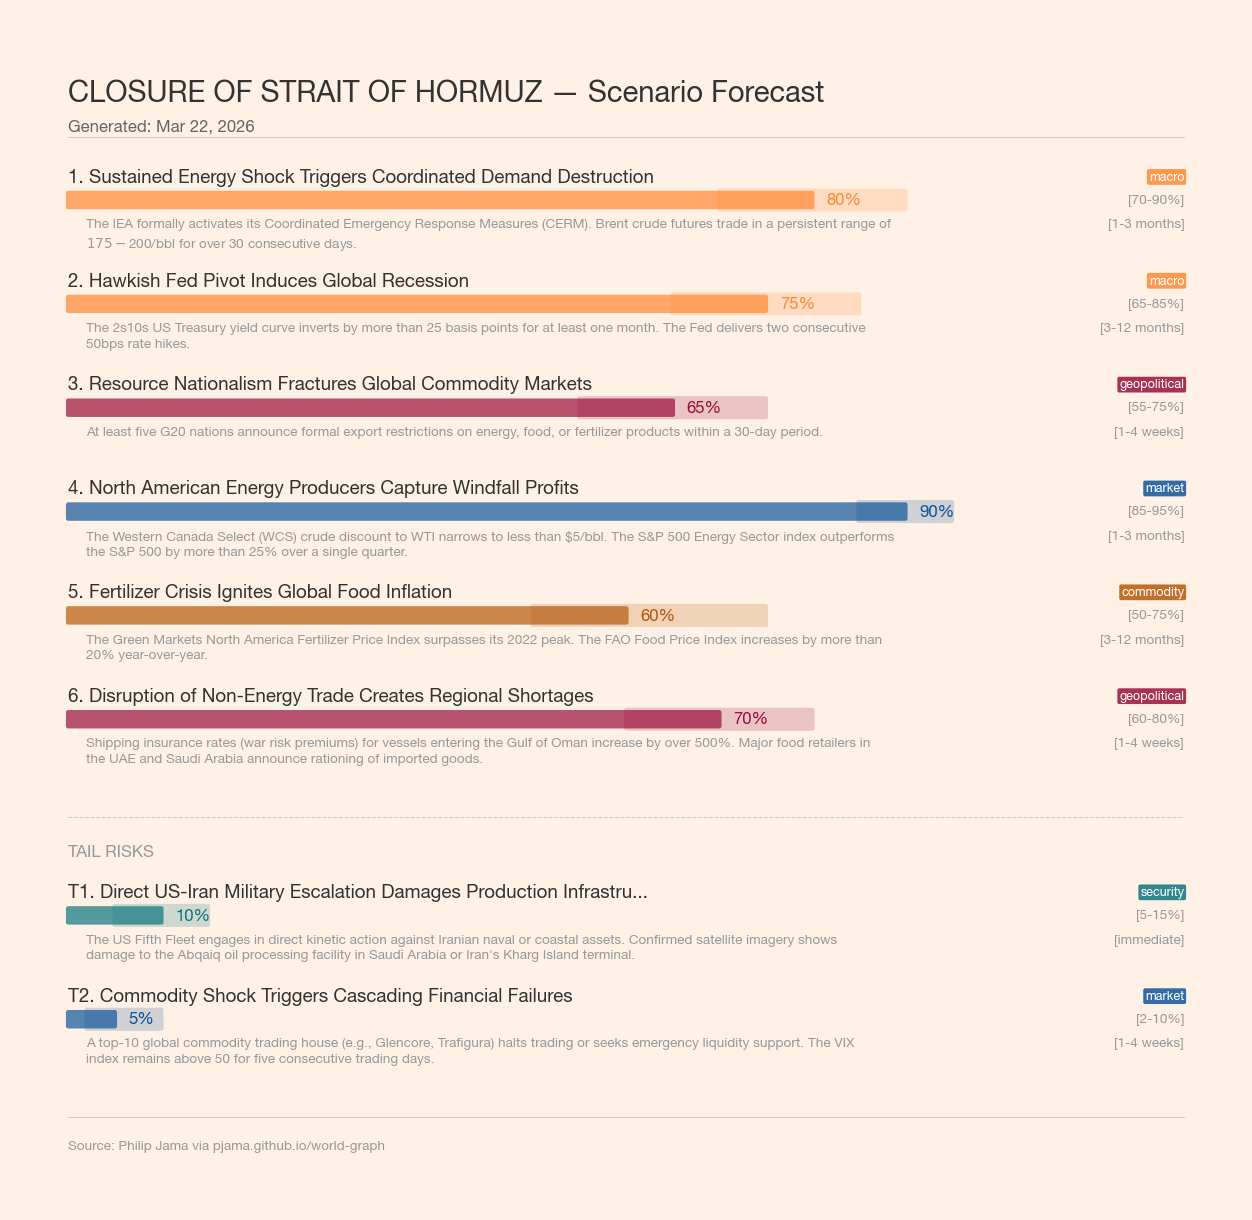
Probability-weighted outcomes: Stagflationary Shockwave (75%), Aviation Margin Collapse (90%), with tail risk analysis.
Load More
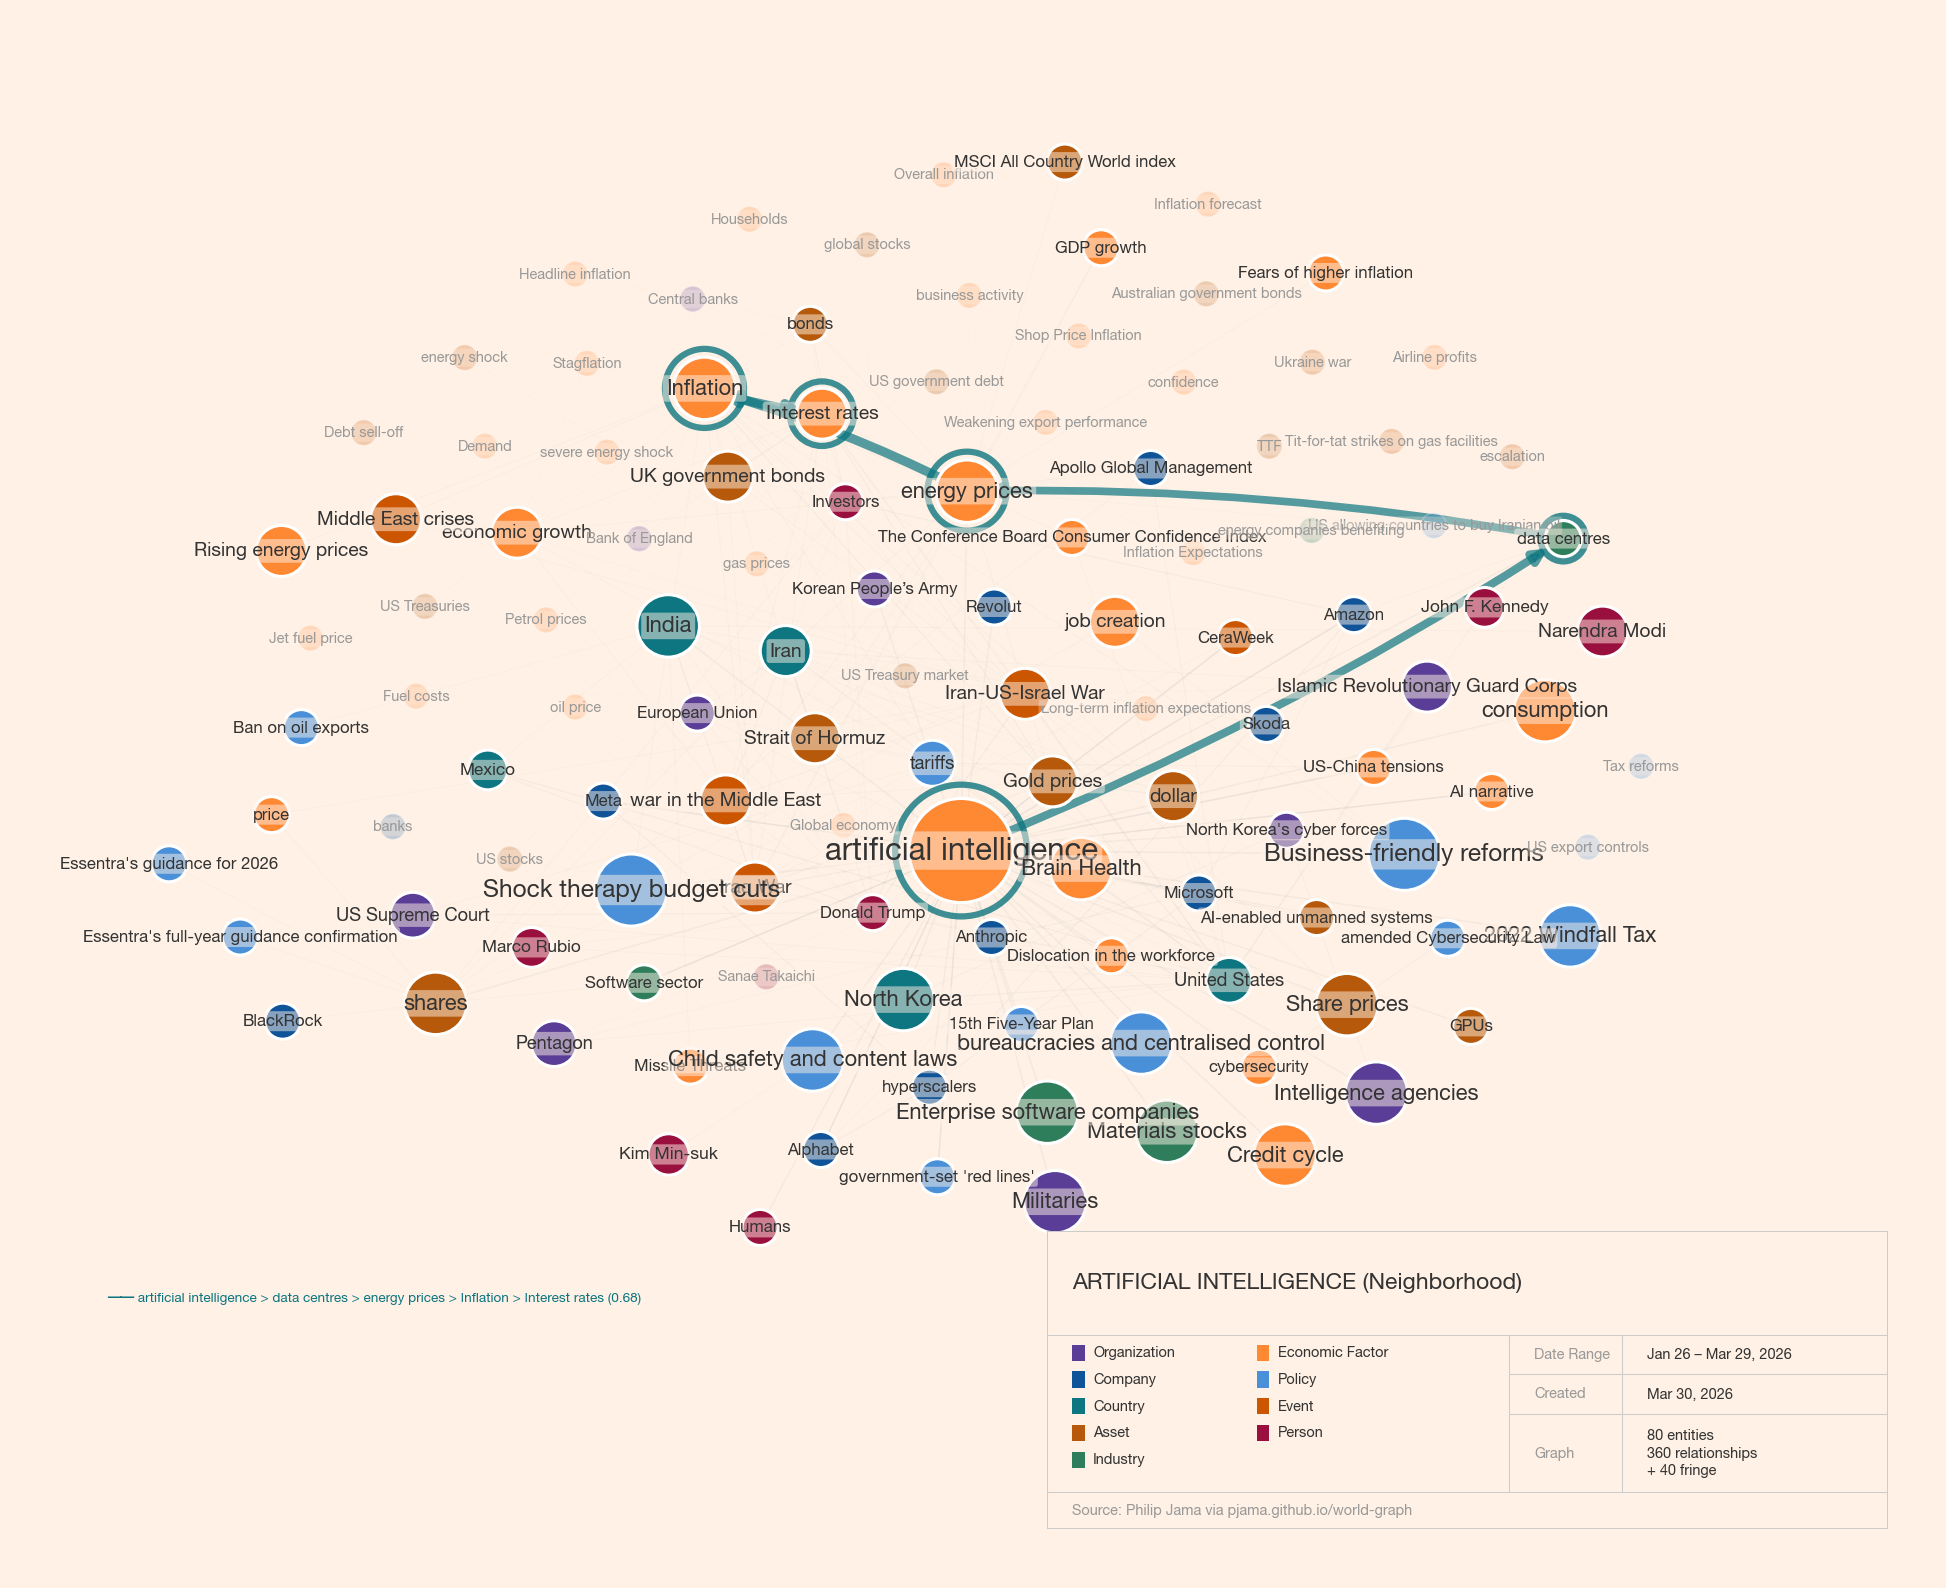
50+ connected entities across energy, defense, labor, and policy — mapping the second-order effects of AI deployment.
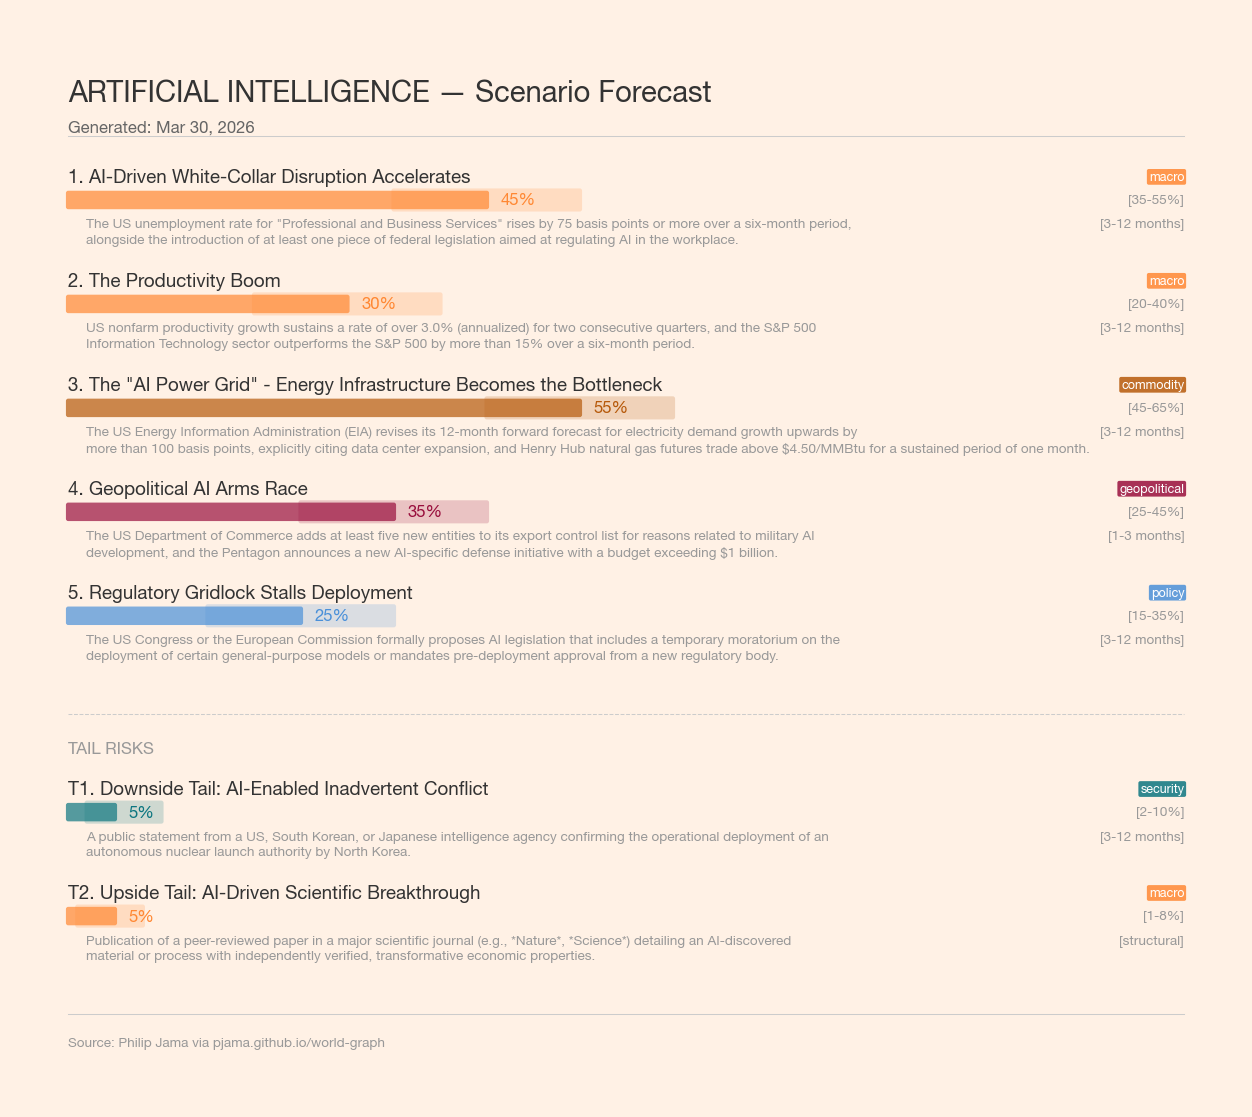
AI Power Grid bottleneck (55%), White-Collar Disruption (45%), Productivity Boom (30%), with geopolitical arms race dynamics.
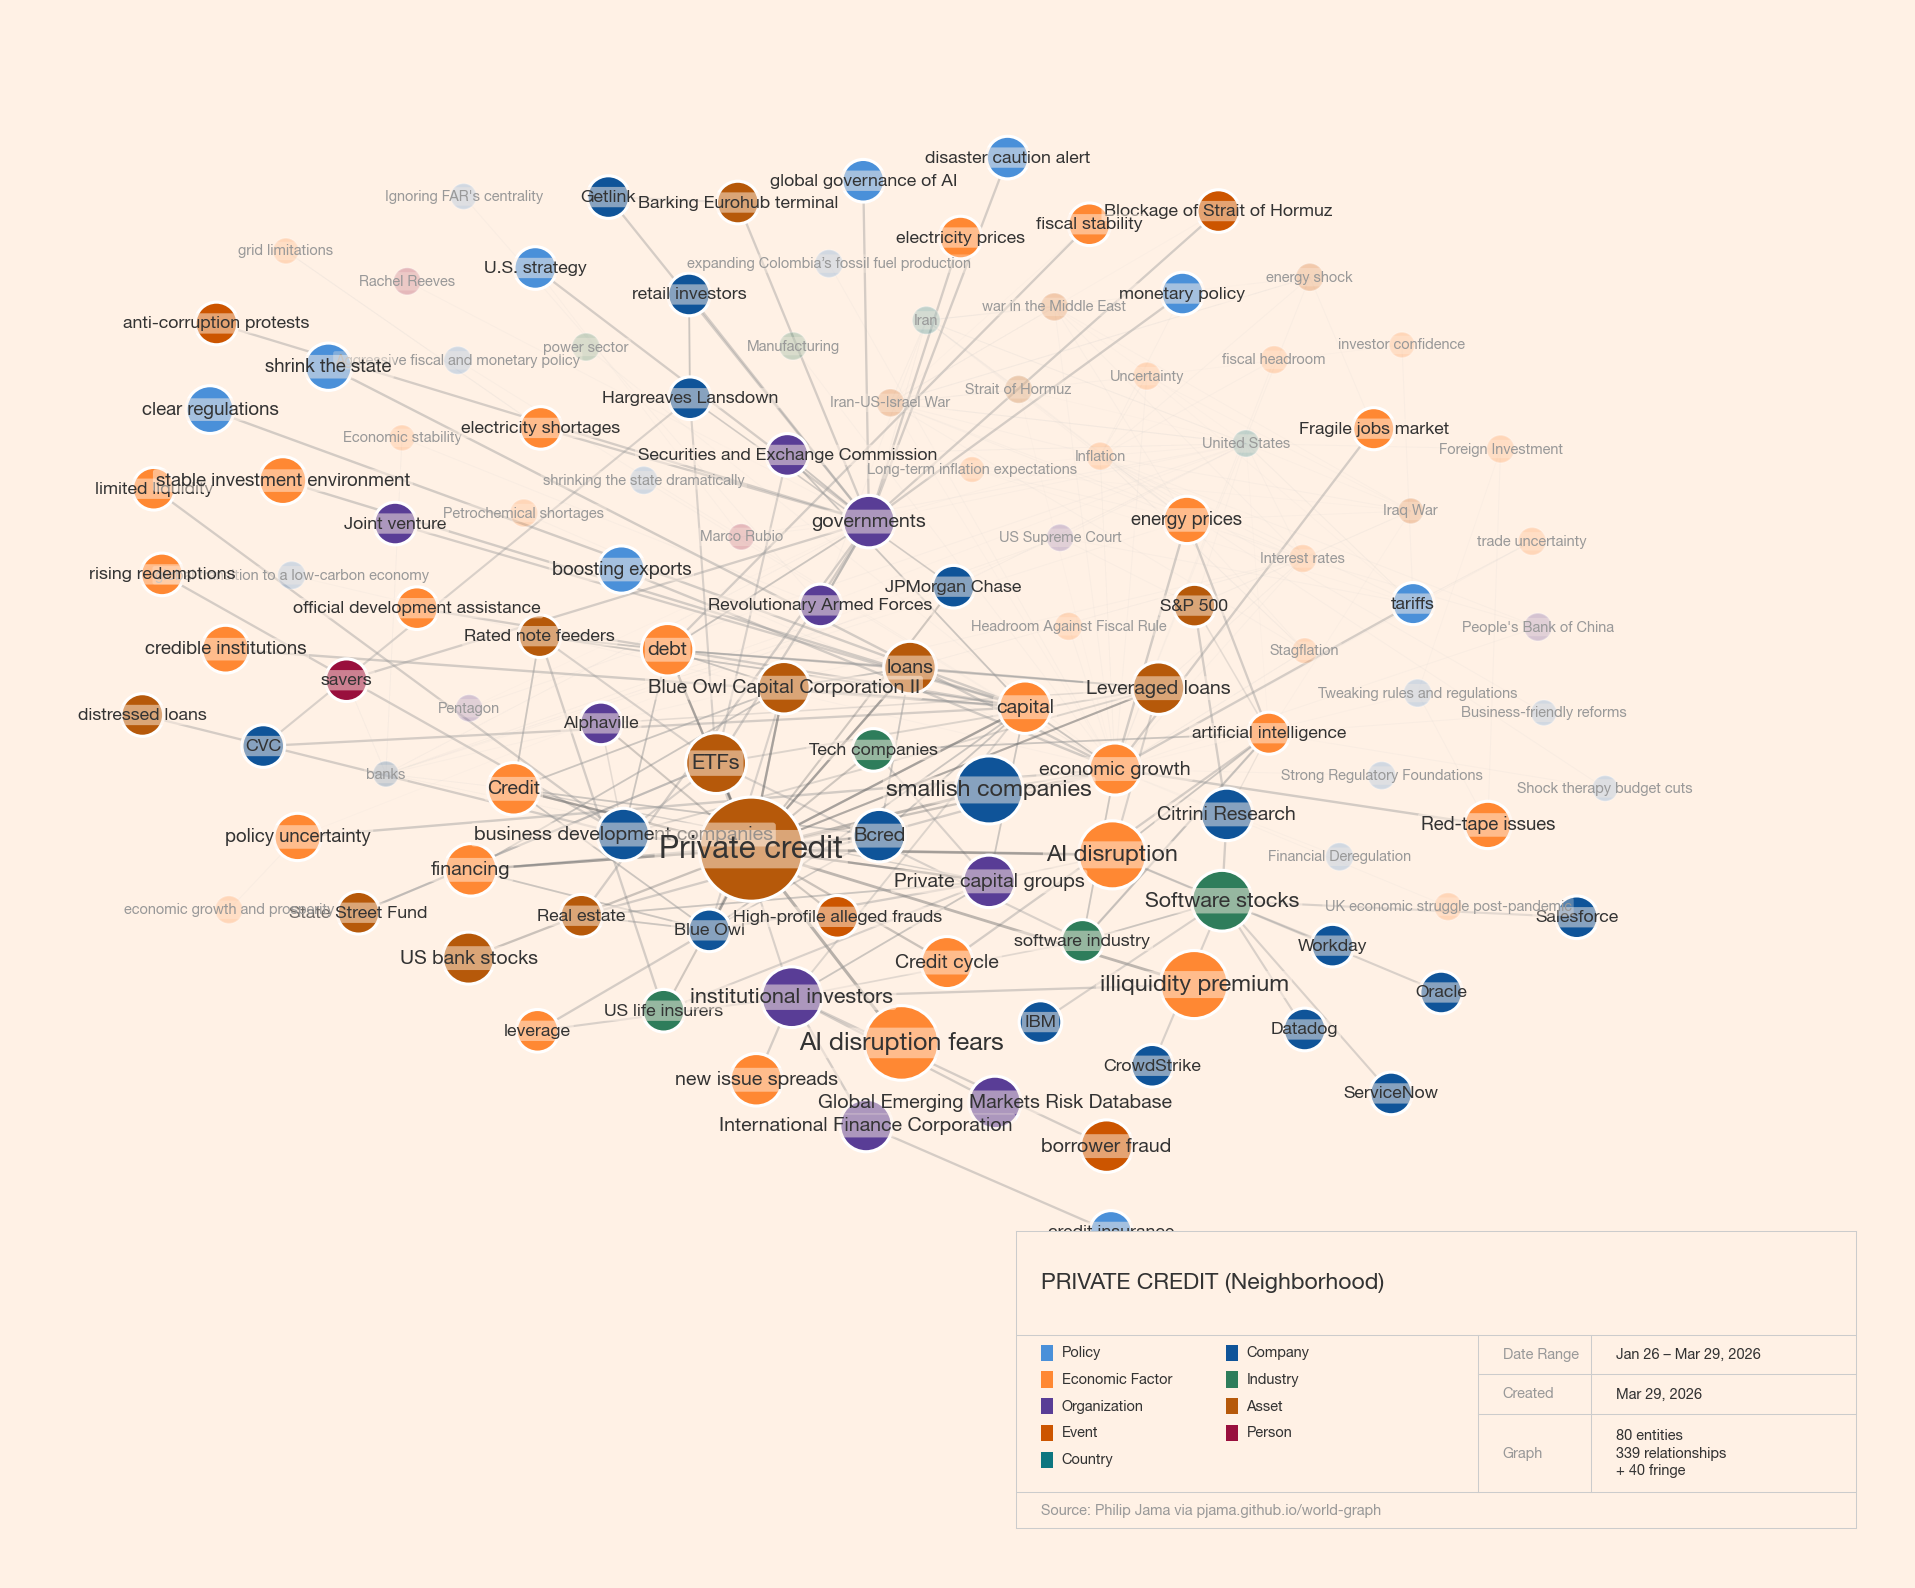
The insurer–private credit nexus: capital groups, feeder funds, BDCs, and life insurers connected through opaque rated-note structures.
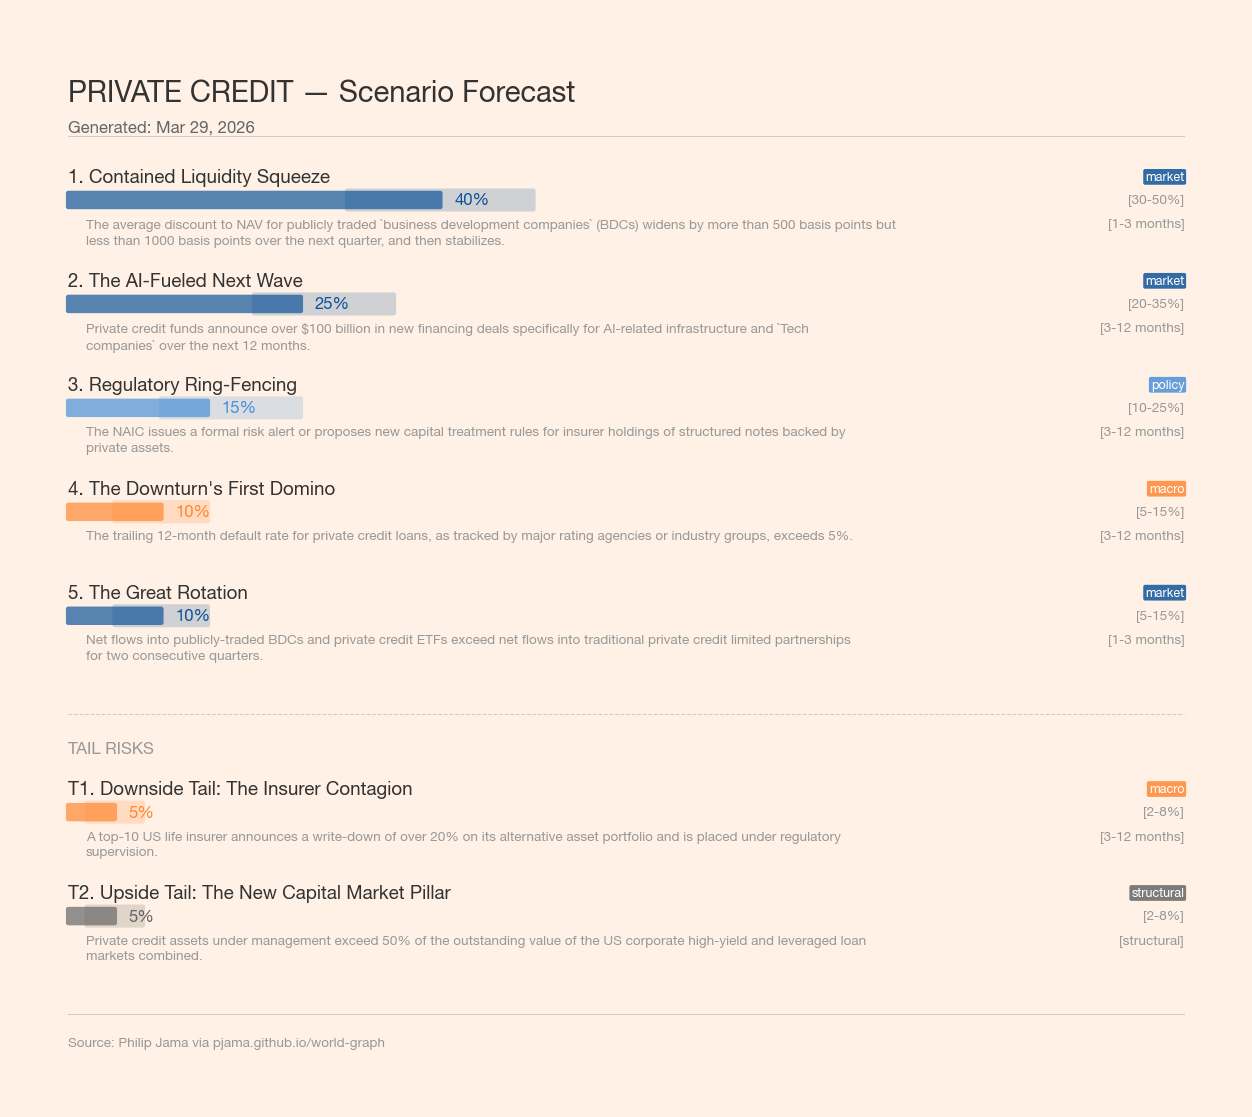
Contained Liquidity Squeeze (40%), AI-Fueled Next Wave (25%), Regulatory Ring-Fencing (15%), with insurer contagion tail risk.
How World Graph Works
Map the Connections
A continuously learning knowledge graph that absorbs new events as they unfold. Countries, leaders, organizations, assets, and policies — connected by weighted, typed relationships that evolve over time.
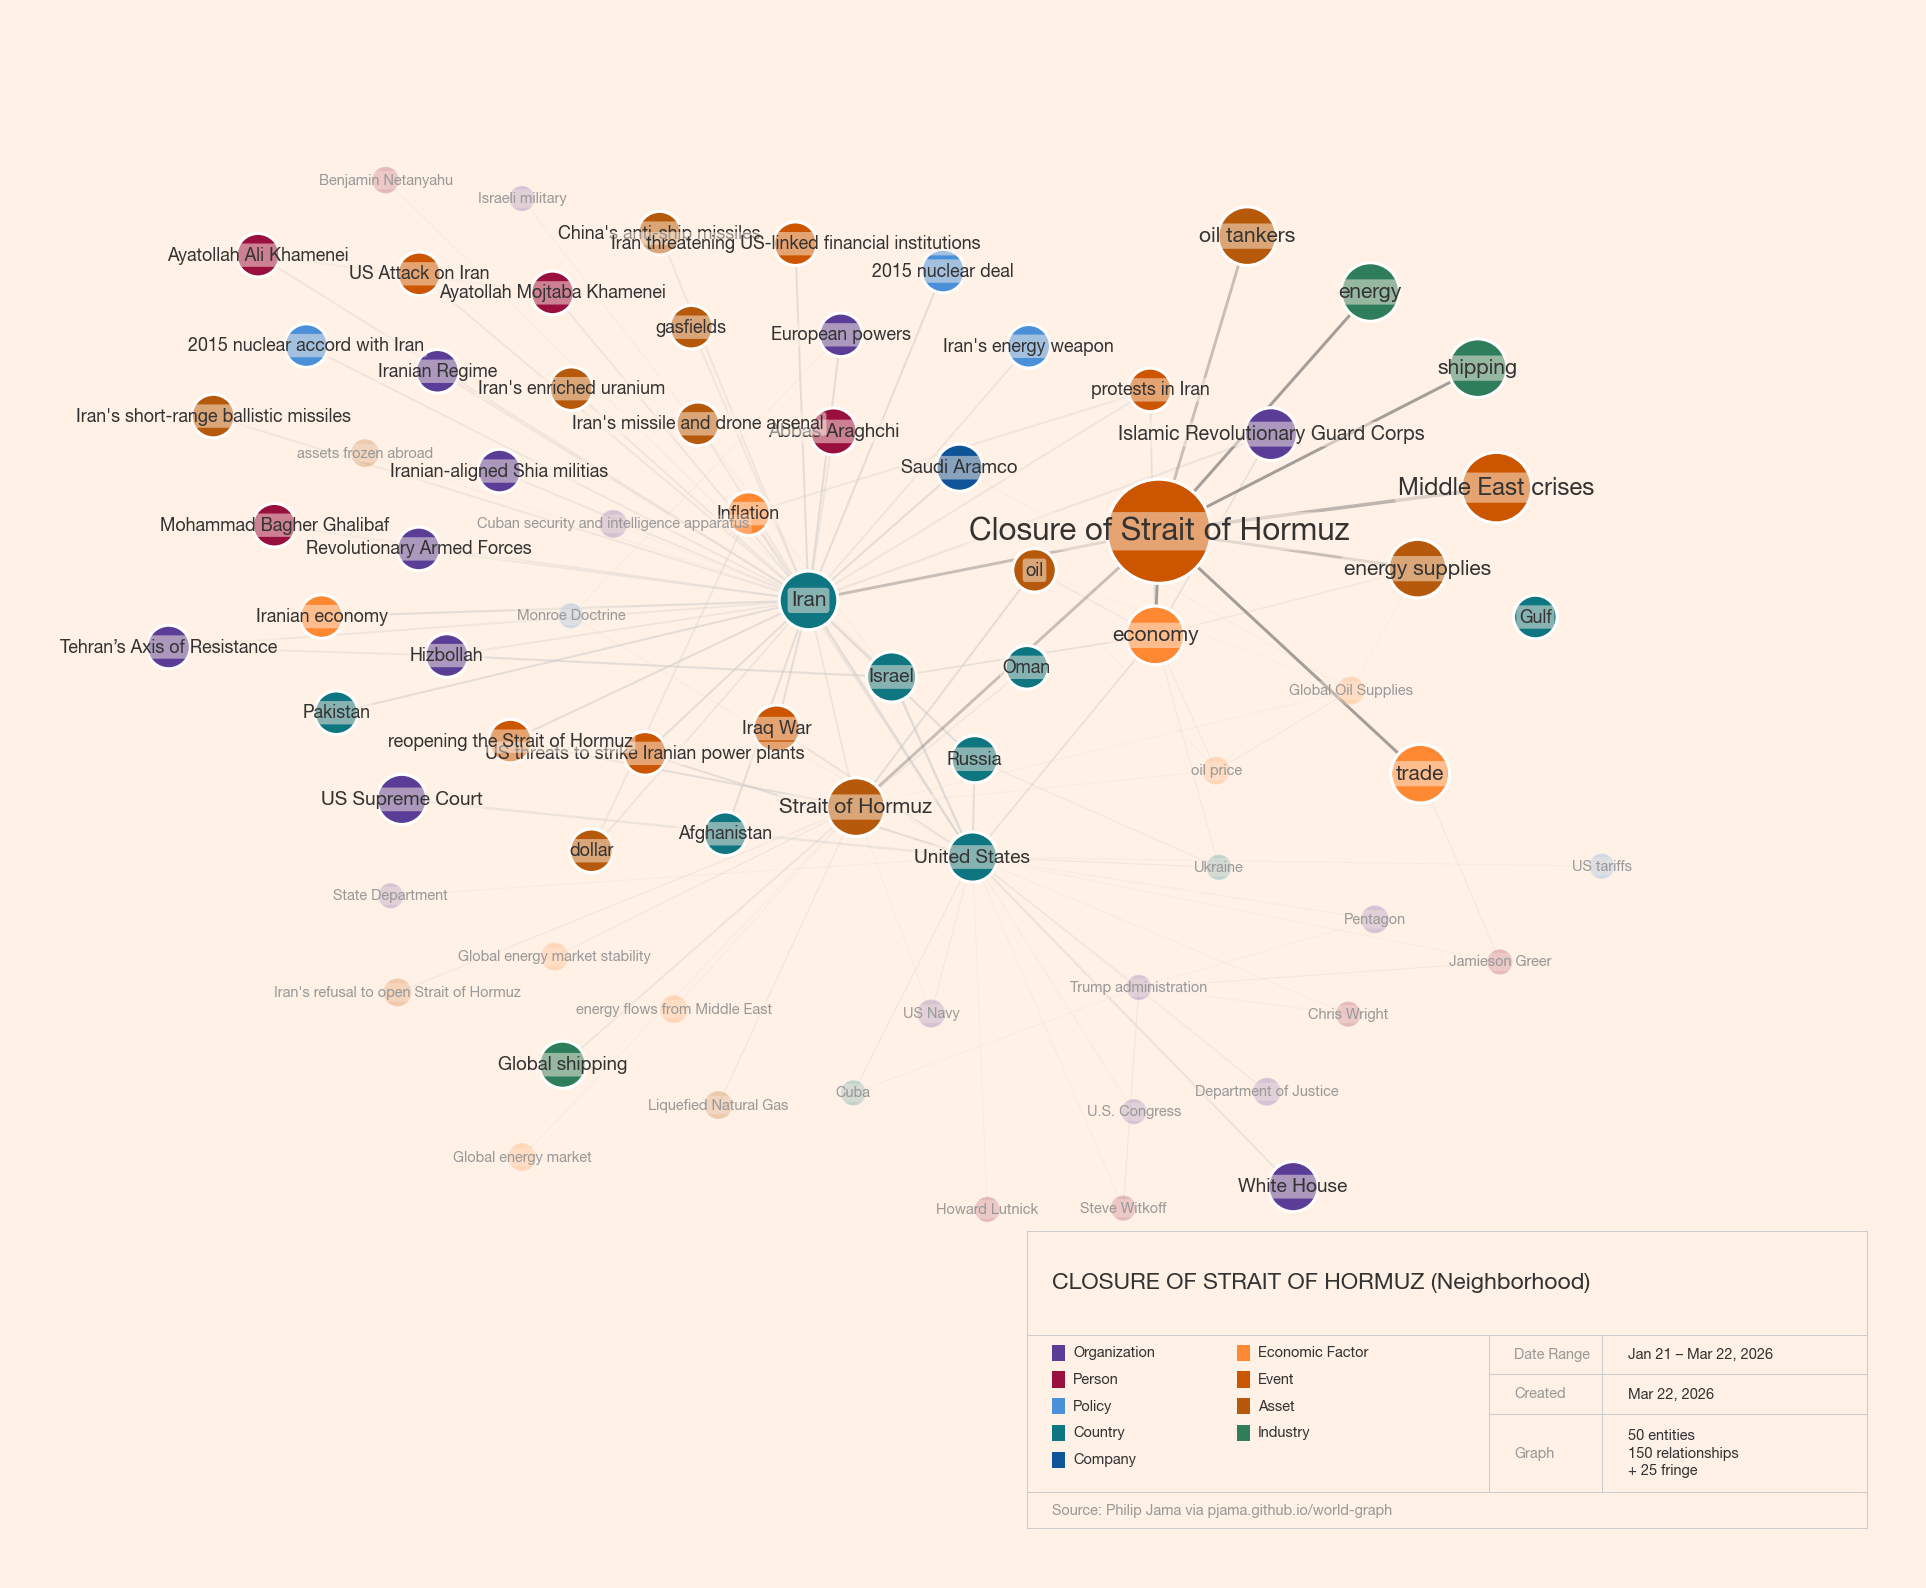
Surface What Matters
Query any topic and see its full neighborhood: every connected actor, asset, and event ranked by relevance across geopolitics, commodities, and finance. The signal, without the noise.
Forecast the Scenarios
Each analysis produces 5–7 probability-weighted scenarios: what could happen, how likely, by when, and what to watch for. Built for people who need to act, not just observe.
Subscribe
Subscribe and get a free deep-dive analysis — scenario forecasts, entity mapping, and probability-weighted outcomes delivered instantly.
Built on graph theory research, network analysis, and 15+ years of ML engineering.