Articles /Network Graph Analysis /Part 8
Temporal Graphs
Modeling graphs that evolve over time
Temporal GraphsGraph Neural NetworksDeep LearningPython
Articles /Network Graph Analysis /Part 8
Temporal GraphsGraph Neural NetworksDeep LearningPython
Real networks change: friendships form and dissolve, citations accumulate, communication patterns shift with the calendar. Static graph analysis captures a snapshot, but the signal often lives in the sequence. Temporal graphs model the dynamics: how structure and features evolve, and how past interactions inform future ones. Building on the GNN foundations from Part 7 (Graph Neural Networks), this article develops temporal representations, time-respecting walks, and the architectures (TGAT, TGN) that learn from time-stamped interactions, then applies them where timing is the whole signal: reading the health of customer relationships from communication patterns.
A static graph is a single photograph; a temporal graph is a film. Edges appear and disappear, node attributes change, and the patterns that matter are often sequential: a burst of activity, a gradual drift, a quiet thinning.
Consider a B2B services company where account managers, support engineers, and executives communicate with client contacts via email, calls, and meetings. Each interaction is a timestamped edge between an internal employee and an external contact, carrying metadata: channel, duration, topic tags, sentiment. The resulting temporal bipartite graph encodes the full relationship history between the company and its customers. A healthy account has regular, multi-threaded communication: the account manager checks in, support resolves tickets, an executive joins quarterly reviews. When those threads start thinning (fewer touchpoints, longer gaps between interactions, conversations narrowing to a single channel), the temporal pattern signals risk before any explicit complaint arrives.
No snapshot can see this. A photograph of the account taken today shows the same people and roughly the same connections as one taken last quarter; the signal is the change in rhythm. Reading it requires representations, walks, and models that treat time as a first-class dimension. The rest of this article builds that toolkit around this account graph.
Two main representations, and the account data could take either form:
(u, v, t, features), exactly as a CRM or message log records it. More expressive, but it requires specialized architectures that process events incrementally.The code below renders the account as a snapshot sequence: four quarterly windows, with threads dropped since the prior quarter drawn in claret.
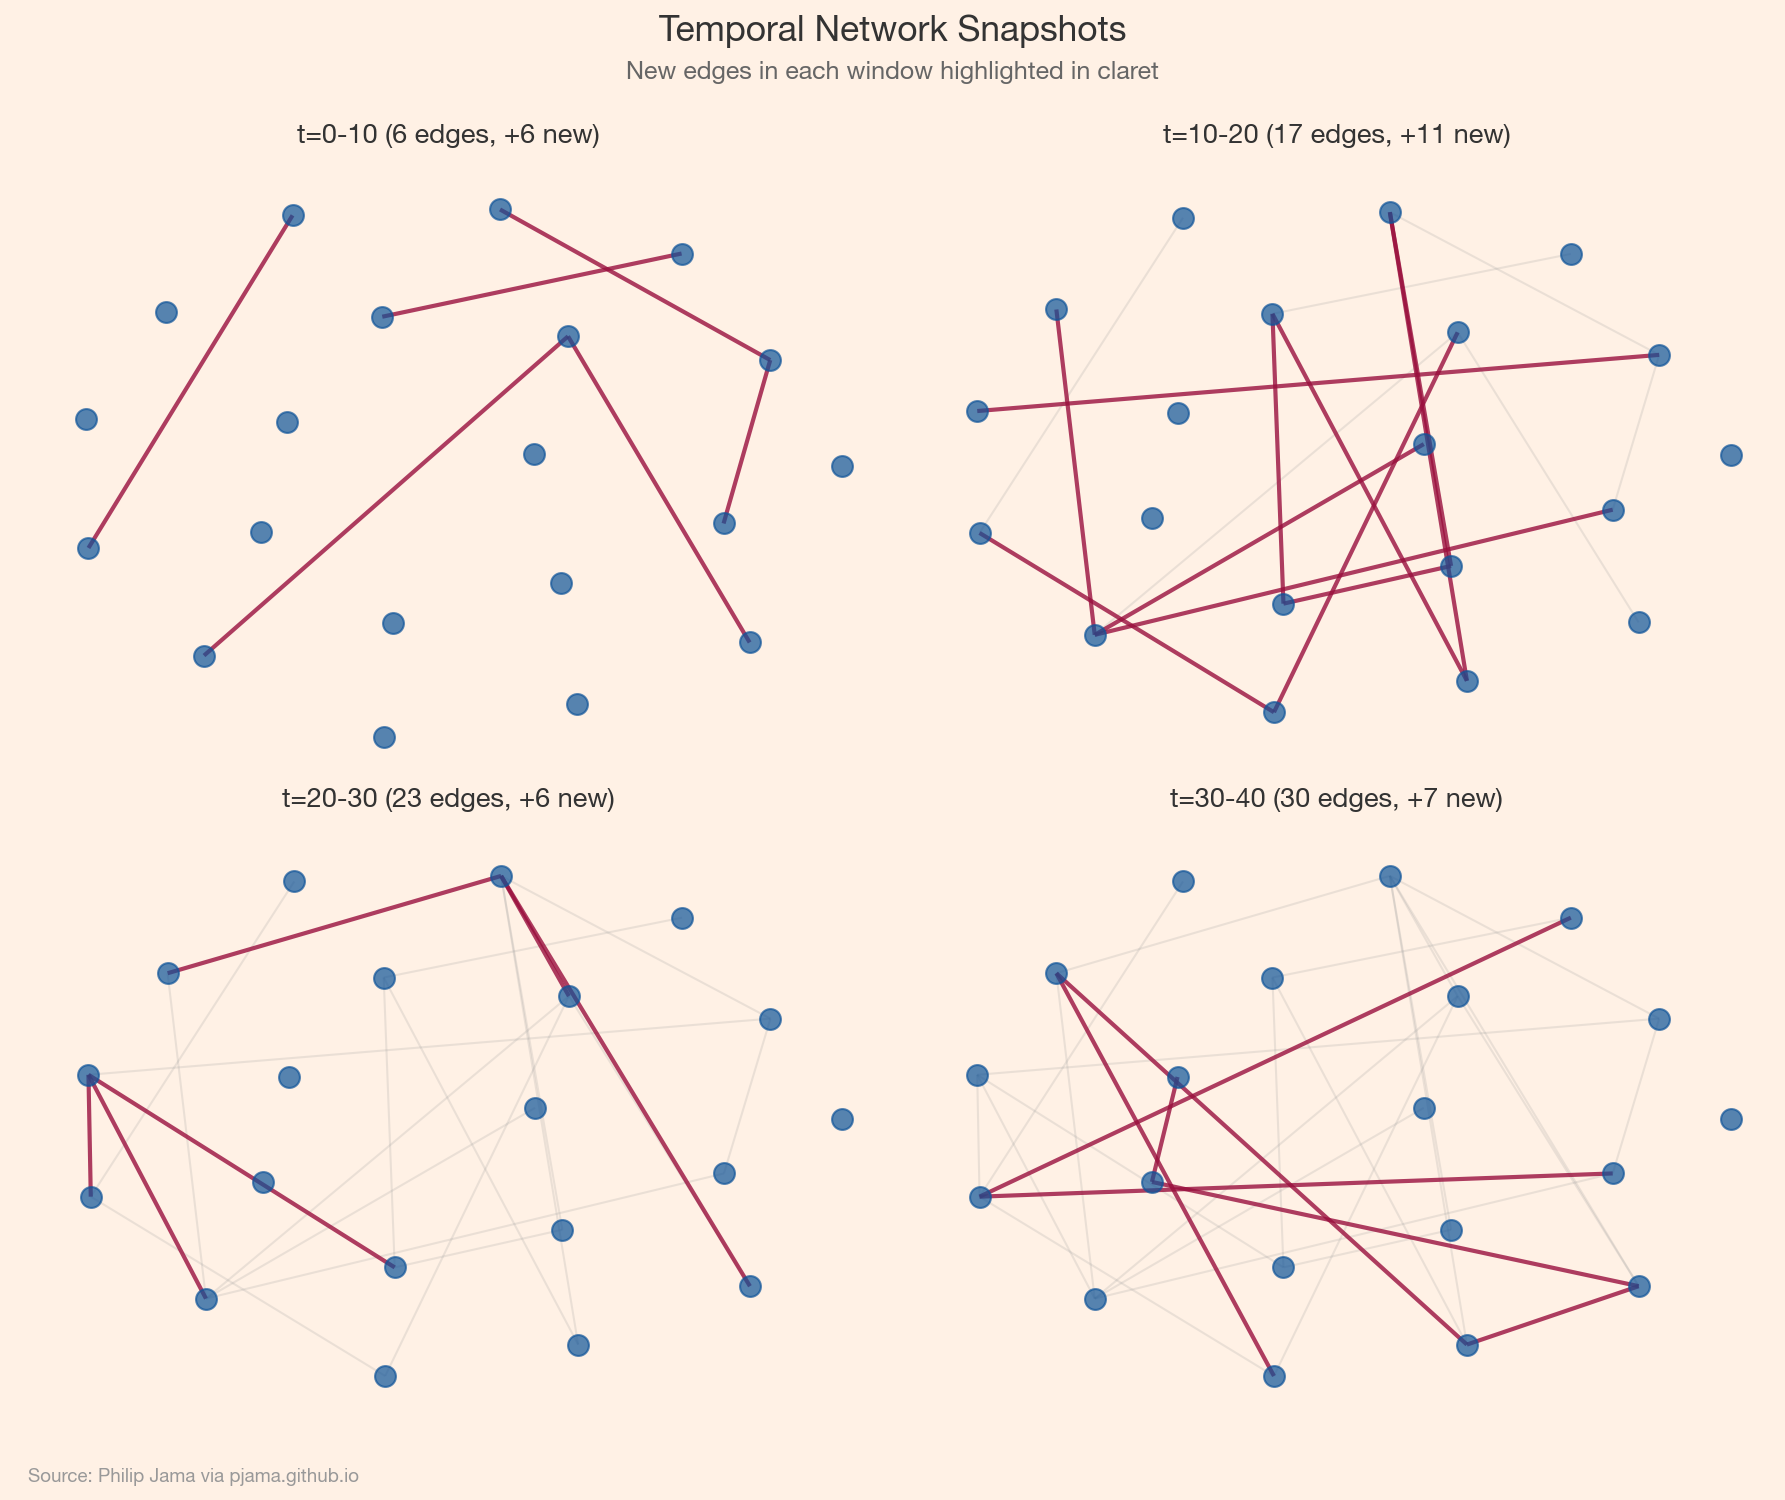
Standard random walks ignore time: a walker can traverse an edge from 2020 and then one from 2015, a path no piece of information could actually have taken. Temporal random walks enforce chronological order: each step must follow an edge with a timestamp later than the previous one. The resulting time-respecting paths trace routes that influence could genuinely have traveled, which makes them the right primitive for questions of temporal reachability and diffusion. CTDNE (continuous-time dynamic network embeddings) feeds such walks into the same skip-gram objective that node2vec uses on static graphs, producing embeddings whose neighborhoods respect time. In the account graph, a temporal walk can connect a support ticket to an executive escalation only if the escalation edges come later; a static walk would happily invent the reverse story.
TGAT (temporal graph attention) brings attention to event streams. Its key component is a time encoding: a learned function that maps the gap between timestamps to a feature vector, playing the role that positional encodings play in Transformers. Attention conditions on these encodings, so the model can learn to favor recent interactions, periodic ones (the quarterly review), or whatever else the task rewards. TGN (temporal graph networks) adds a memory module: each node carries a state vector summarizing its interaction history, updated by a recurrent cell after every event that touches the node. Memory is what lets a model hold a long-term baseline for each account while attention handles the recent context. Both process events in order and produce continuously updated embeddings suitable for link prediction and anomaly detection.
Aggregate metrics make the thinning legible without any model at all. Tracking metrics across time windows (touchpoints, active threads, channel diversity, the gap between interactions) tells a story that no single snapshot captures. The code below replays the account's four quarters and plots the trace, with the churn risk window marked.
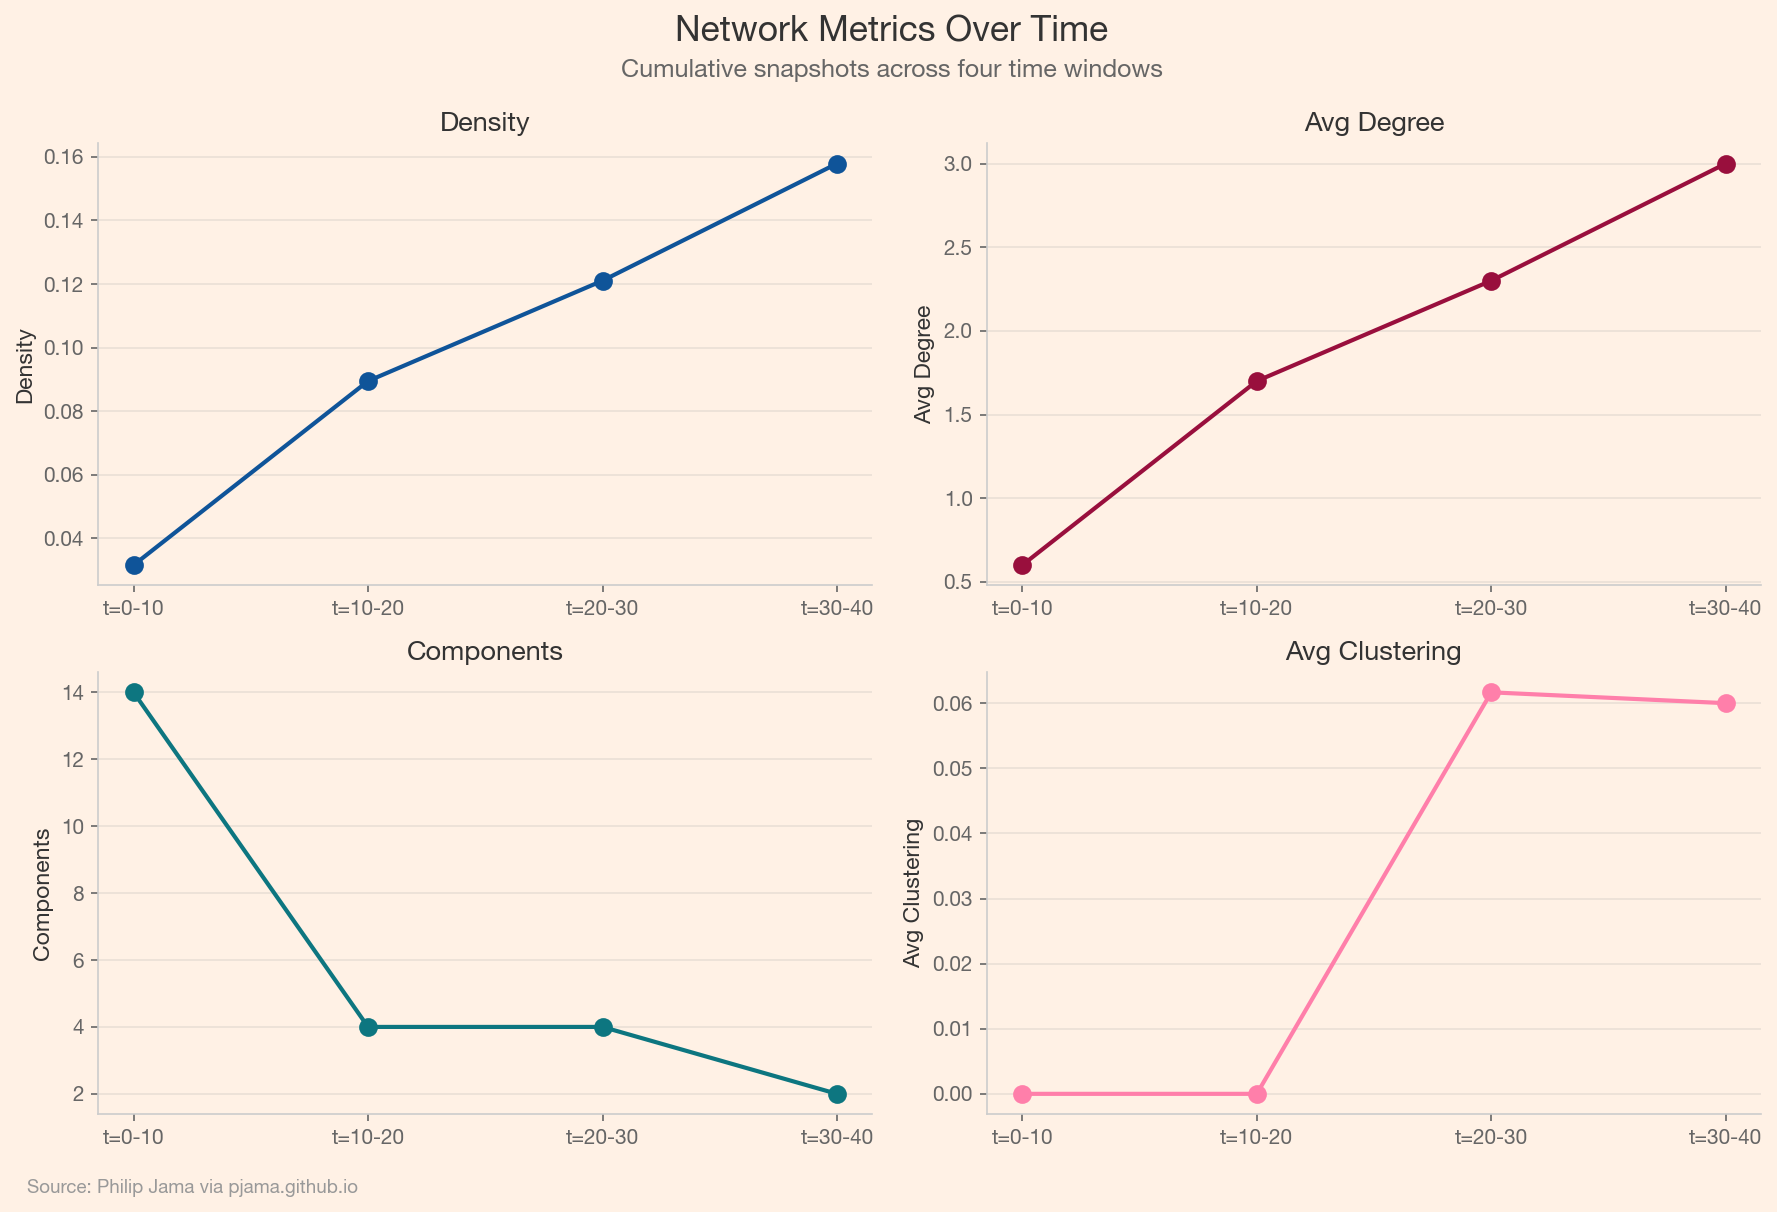
Link prediction on this graph asks: given the communication history up to time t, which edges are likely to occur at t+1? A TGN trained on historical account data learns the cadence of healthy relationships. When the model predicts a touchpoint that fails to materialize (a quarterly review that doesn't happen, a support thread that goes unanswered), the gap between prediction and reality becomes a churn signal. The account team can intervene before the silence becomes a cancellation.
The same graph supports anomaly detection from the opposite direction. Instead of predicting missing edges, flag edges that shouldn't be there, or that deviate sharply from the learned pattern. A sudden spike in support tickets from a previously stable account, a burst of escalation emails bypassing the usual contacts, or a dormant executive relationship that abruptly reactivates: these are temporal anomalies that carry operational meaning.
The temporal dimension is essential here. A single support ticket is routine. Five support tickets in a week from an account that averages one per month is an anomaly that only surfaces when the model understands the baseline rhythm. Static graph analysis would count edges; temporal analysis understands tempo.
The practical value comes from connecting graph signals to business workflows. Link prediction scores can feed a CRM dashboard that ranks accounts by engagement risk. Anomaly scores can trigger alerts routed to the relevant account manager. Temporal community detection (identifying clusters of client contacts who interact with different internal teams) can surface accounts where communication is siloed and a single point of failure exists. The graph does not make the decision, but it surfaces the pattern that would otherwise remain buried in thousands of individual interactions.
The account graph is one instance of a general pattern: any relationship system has a tempo, and the tempo carries information that structure alone does not. The geopolitical world graph from Part 6 (GraphRAG) is another instance. There, nodes are countries, leaders, companies, and macro factors, and each news event refreshes an edge; an edge that stops being refreshed decays, exactly like an account thread going quiet. The same machinery transfers. Temporal baselines separate a routine diplomatic exchange from an escalation burst, and a missed cadence (a summit that does not happen) is as informative as a new edge. The World Graph applies this temporal layer to daily news, tracking which relationships are heating, cooling, or going silent.
Temporal networks model how graphs change but not why. Causal and Bayesian networks add directionality and interventional reasoning.
If you're exploring related work and need hands-on help, I'm open to consulting and advisory. Get in touch›